Kirey Group has defined and tested an innovative solution for the collection, monitoring and graph of network metrics thanks to the technology Elastic Stack
By Lisa Vaccarino, Solution Architect at Kirey Group and Daniele Saccon, Elastic Certified Engineer at Kirey Group.
Today companies need integrated and unified monitoring platforms to face the performance monitoring of increasingly complex, dynamic and heterogeneous architectures.
Read also
"New challenges in the monitoring strategy: customer experience, observability and data correlation"
Kirey Group addresses specific monitoring needs on the different IT Area (Infrastructure, Network, Security, Applications) with an approach vertical and holistic at the same time. On the other side, the necessity to analyse data coming from different sources in a correlated and integrated way is implemented thanks to new modern platforms based on big data repositories and advanced algorithms for analysis.
The deep know-how on monitoring and analysis technologies and the specific skills developed in the field over the years, allows Kirey Group to develop a new solution for monitoring network metrics, designed to transform the metrics collected from IT devices (of any type) into information which can be KPIs, actions, dashboards, automation.
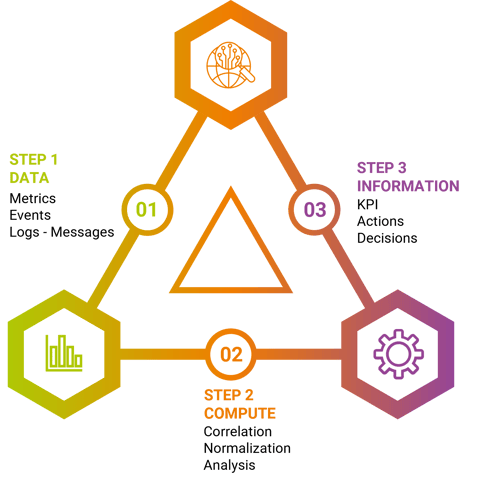 Figure 1 - Monitoring Evolution Process
A new Network Performance Monitoring solution
After a first laboratory phase, Kirey Group has developed this modern platform for the collection, monitoring and graphic representation of network metrics to meet the following objectives:
- Guarantee a deep coverage of the data collected through SNMP and NetFlow from traditional network devices and for SD-WAN devices.
- Improve the capability to analyse and correlate data in a single point.
- Give information to improve the troubleshooting processes.
To implement this solution, Kirey Group selects Elastic Stack as main technology stack.
Benefits
1) Big Data Repository
Elastic Stack is the de-facto standard to implement a centralize system to collect data from different sources not only related to Network Monitoring. It is big data repository built to store heterogeneous data in a non-structured way and offers high flexibility in data visualizations and custom developments.

Figure 2 - Elastic Stack Layers
The data sources can be addressed from network devices like NetFlow and cFlow, from servers like logs, from cloud manager and be correlated in Elastic Stack installation in customer environment.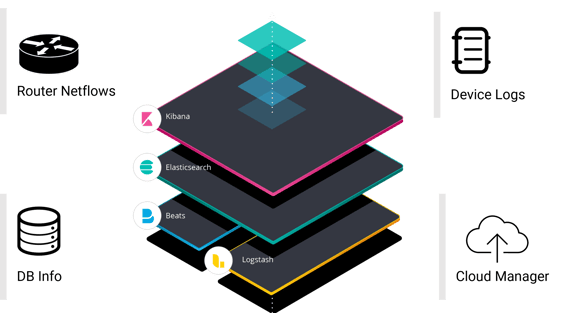
Figure 3 – Elastic Stack Data Collection
2) Customization
The Elastic Stack solution proposes some module for data collection already developed but is possible to customize the plugin to collect new data sources and present it with different aggregations and visualizations that are available via web pages integrated with a user role-based access.
3) Saving
Elastic Stack has a licensing model more suitable to manage a huge size of data without an exponential increase in costs for future expansion or separation with the respect to the traditional platform.
The possibility to adopt the proposed platform in on-prem, SaaS or hybrid deployment, allows to evaluate and even also reduce the internal infrastructure costs.
4) Network Monitoring Infrastructure Design
In the following schema the design implemented to monitor the SNMP, NetFlow and cFlows data from customer network devices located in different branch offices.
The Elastic Stack layers are installed in an on-prem cloud or are available as a SaaS on Elastic Cloud environment.
The end users have access on the Kibana Visualization layer and have the visibility only on the selected data related to the belonging branches.
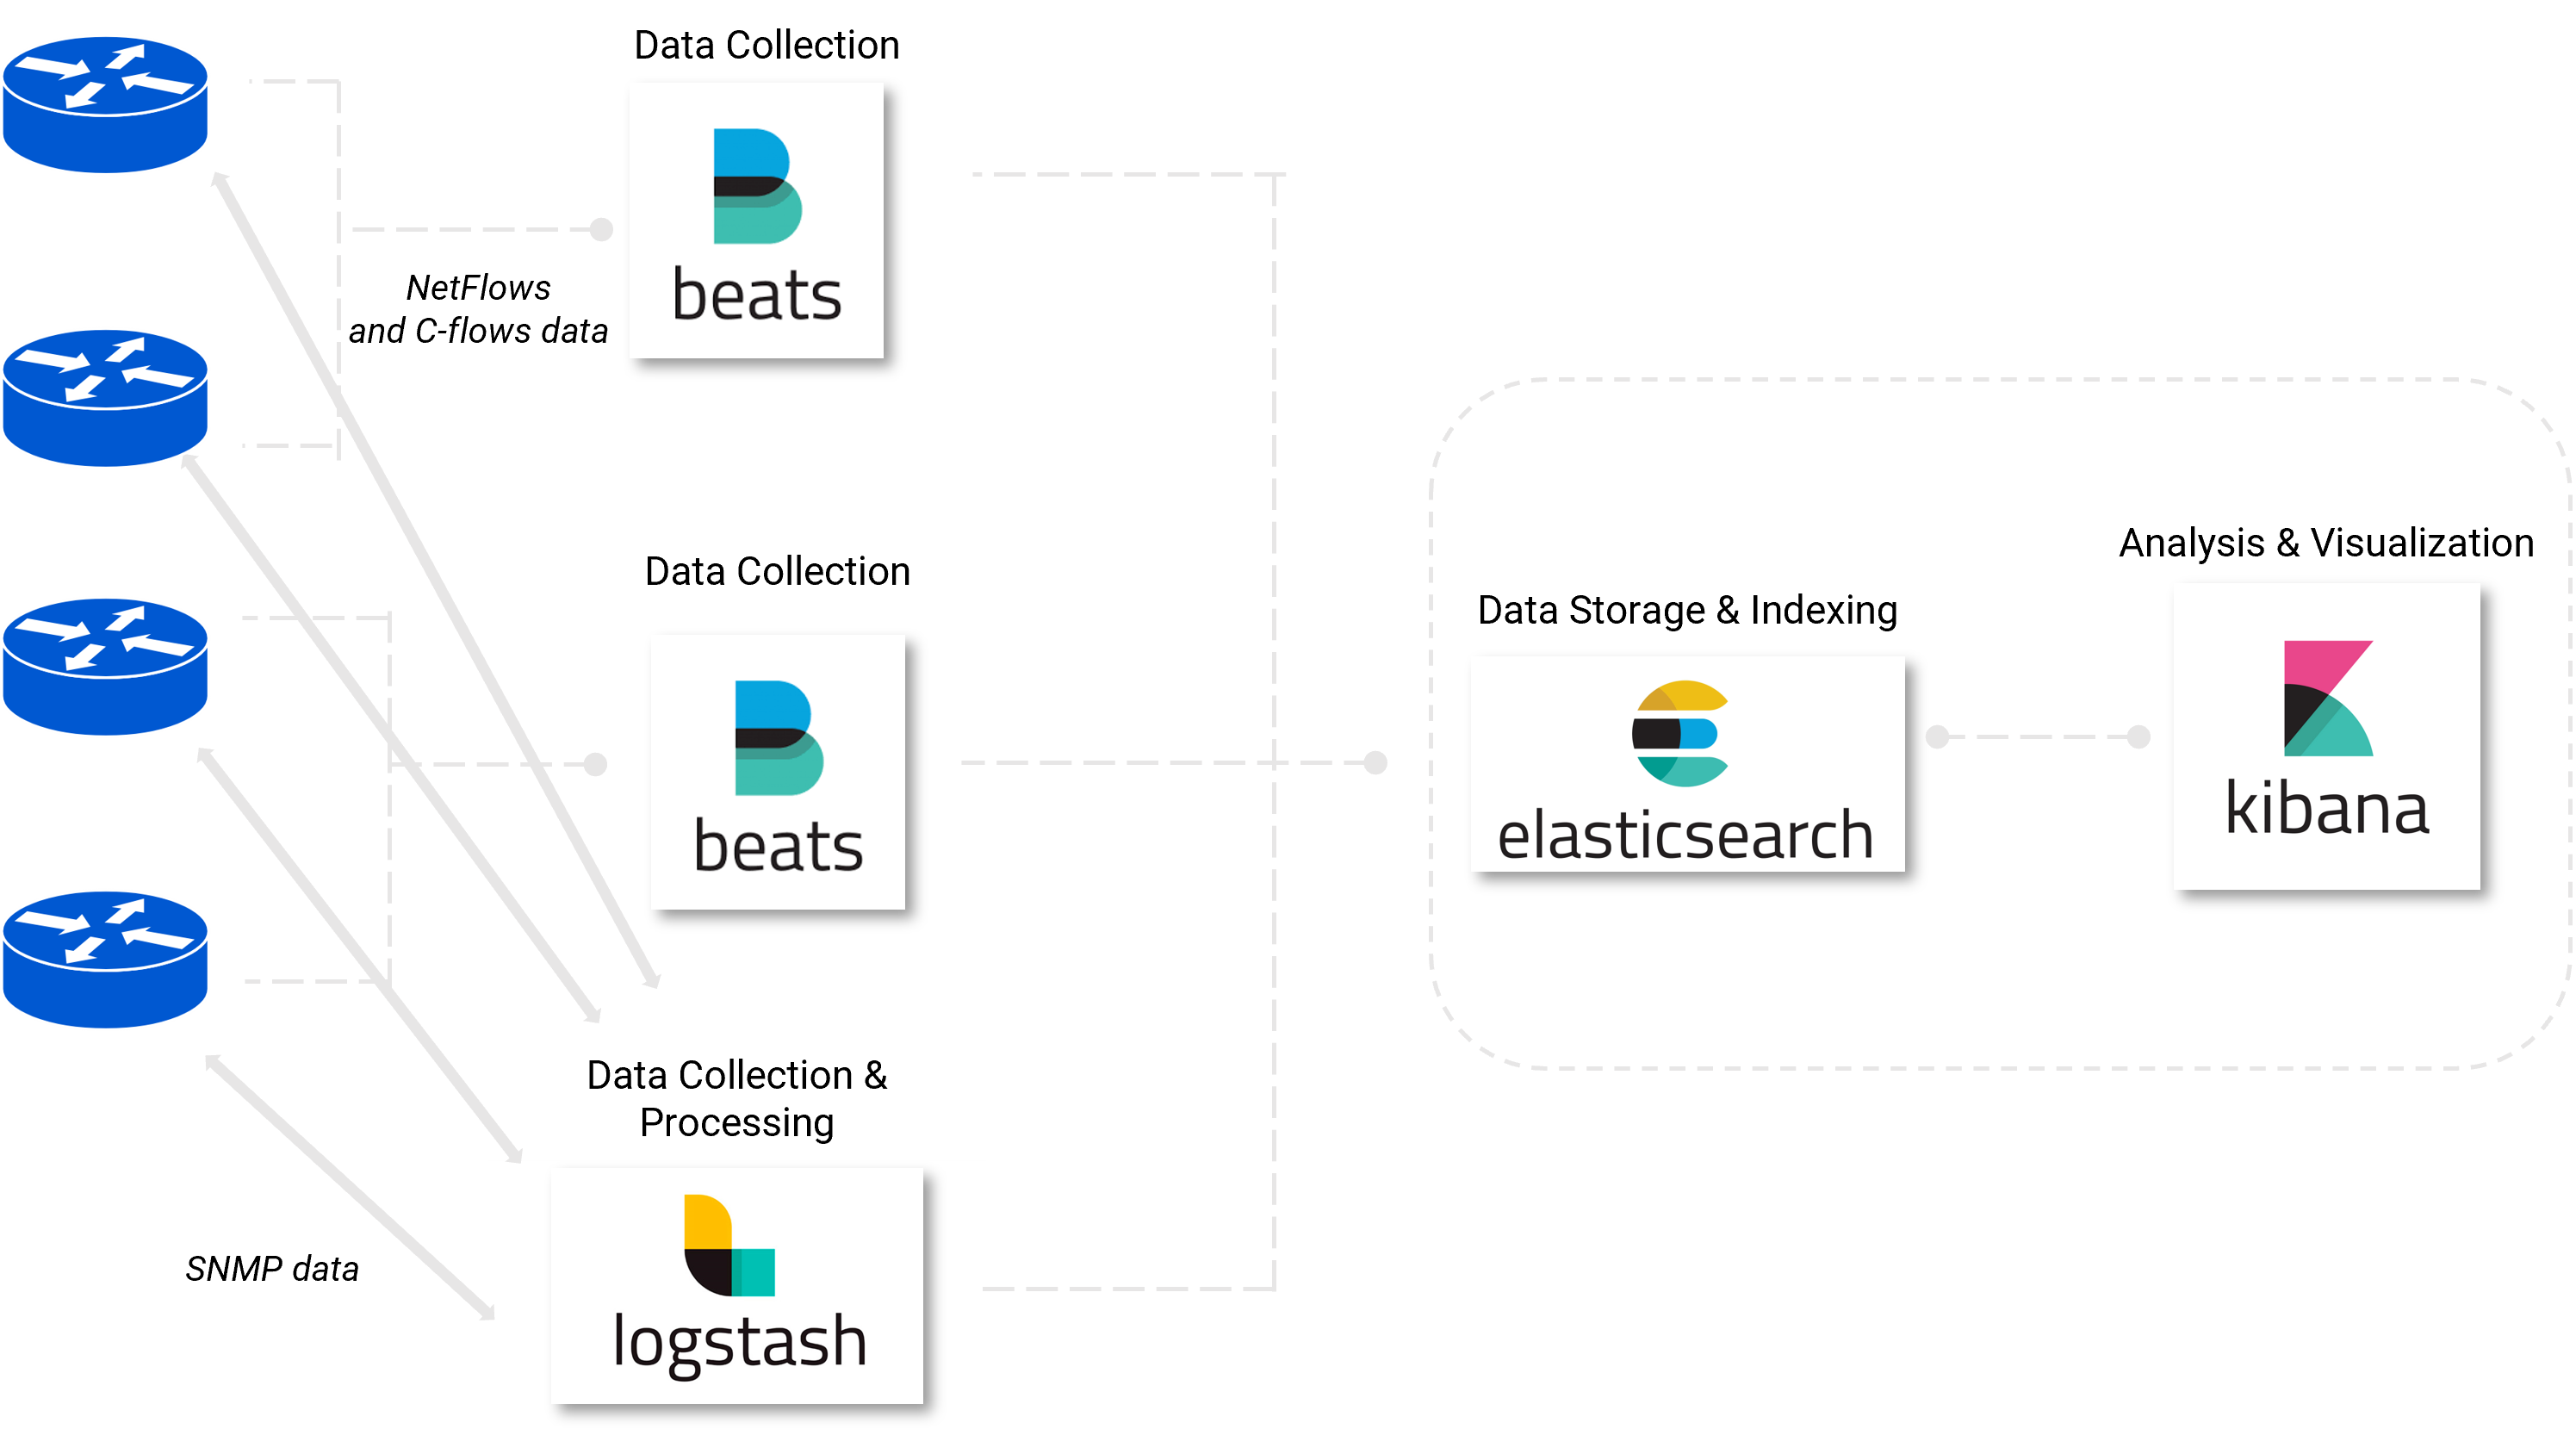
Figure 4 – Network Monitoring Implementation
5) Data Retention
The retention for aggregated data on Elastic Cloud are based on metrics
|
Elasticsearch enables to implement a hot-warm-cold architecture to meet performance requirements for newest data, control costs over time, enforce retention policies, and still get the most out of data. A lifecycle can have up to five phases: hot, warm, cold, frozen and delete. |
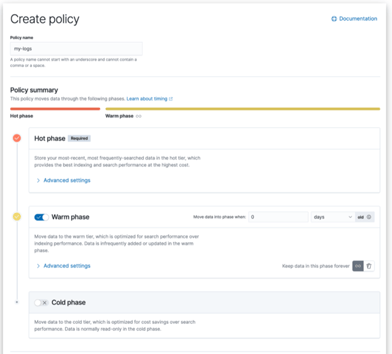
|
6) Data Security
The use of Azure Private Link with Elastic Cloud provides an additional layer of security to meet security policy and compliance requirement.
Infact, with Azure, the communication between private cloud platform and Elastic Cloud will be managed by a unique identifier and allow traffic communication only from and to Filebeat and Logstash collectors.
All traffic to Elastic Cloud can be routed through the private endpoint and are not needs gateways, NAT devices, ExpressRoute or VPN connections and public IP addresses.
7) Dashboards
This solution allows to have a single point of convergence for data visualization, exposed in dashboard, ensuring the production of customized reports to map the users requirements.
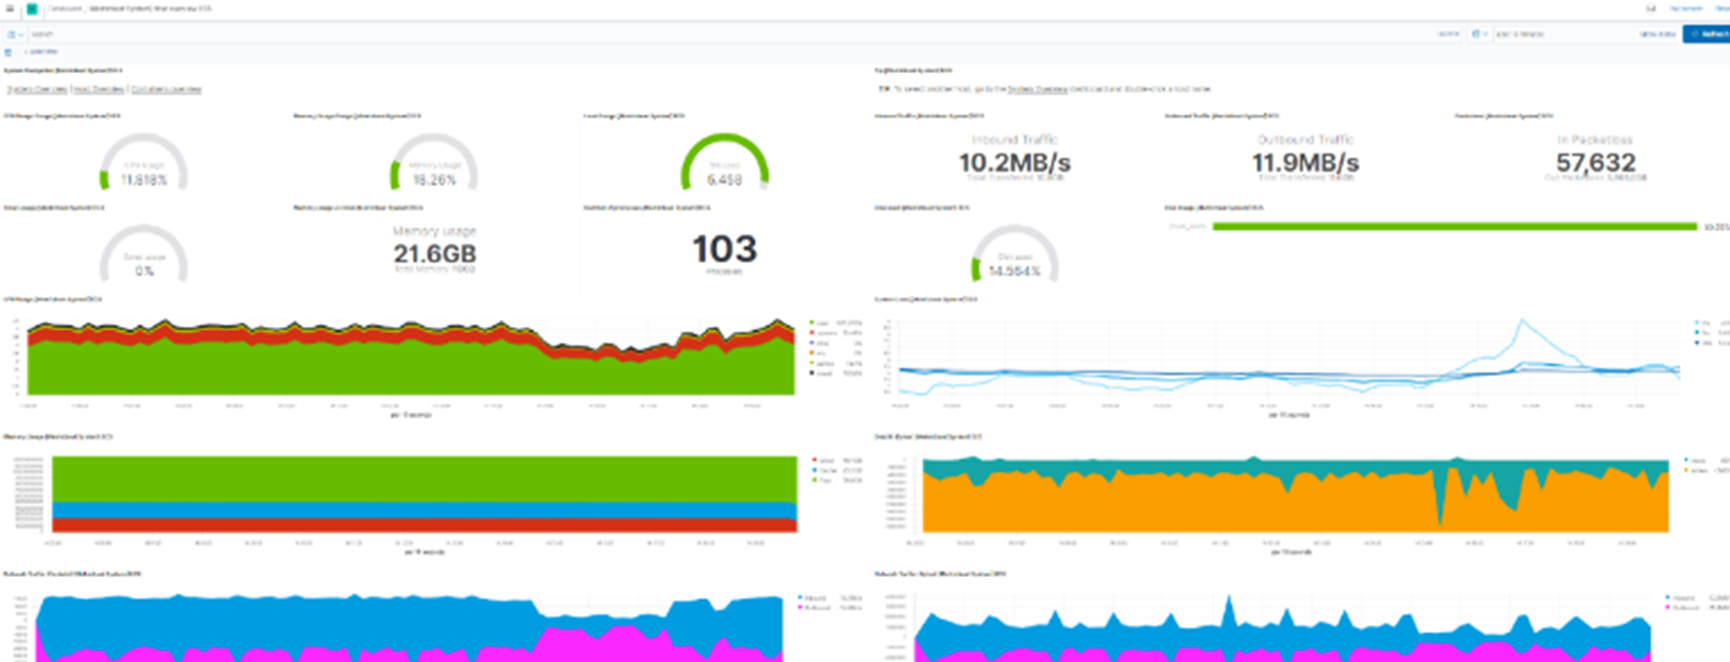
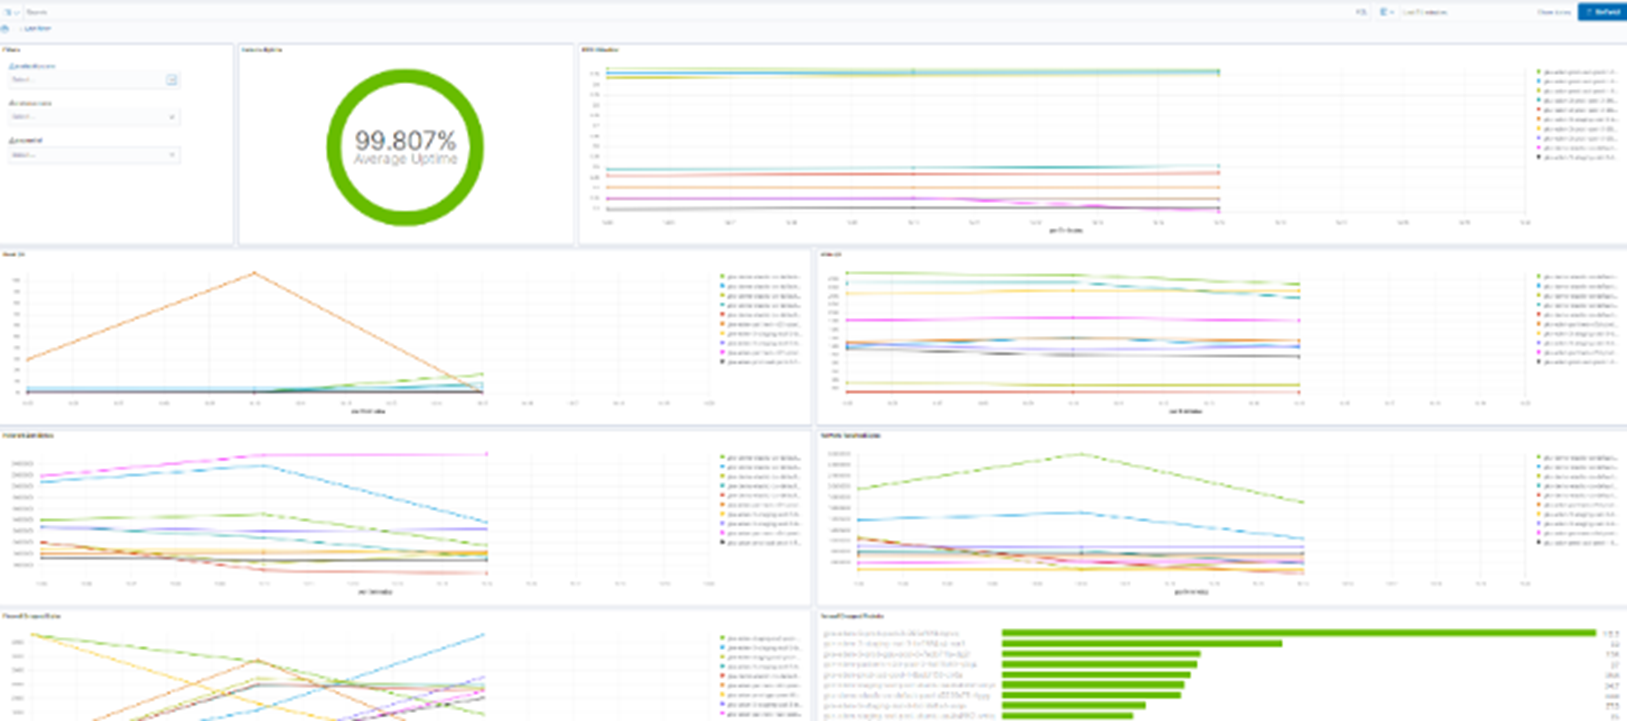
Figure 5 – Some examples of dashboard created for data visualization
Do you want to explore the solution?
Get in touch with our experts!

